

CONTRIBUTORS

Jim Stoeffel
Portfolio Manager

Andrew Palen
Portfolio Manager
The Market’s Best Kept Secret?
US micro-cap stocks are having a moment.
This may come as something of a surprise since the financial press has not written or said much about how well this important—and opportunity-rich—subset of small-cap has performed over the last several months. In fact, we feel confident saying that many investors don’t know that micro-caps have been leading the US equity markets for more than a year now, dating back to the market low on April 8, 2025. We’d also be willing to bet that a sizable number of investors have only a vague idea that the asset class exists in the first place.
To be sure, it sometimes requires a little effort on our part to establish the fact that small-caps as a group (never mind their more diminutive siblings) have enjoyed different long-term performance patterns than large-caps—and that the two asset classes have historically jockeyed for leadership in cycles that, for small-cap, have averaged around 10 years.
So, while we have been investing in small- and micro-cap stocks for more than 50 years, we are used to having to evangelize a bit about why small- and micro-cap stocks are worthy of consideration in any long-term investment plan. Additionally, the lengthy nature of prior small-cap leadership tenures is one of three reasons why we’re confident that small- and micro-cap stocks can stay in the driver’s seat for a long time. (The two other reasons are covered below.)
We believe this even as the recent results for micro-caps have been nothing short of stellar—on both an absolute and relative basis:
For the year-to-date period ended 6/30/26, the Russell Microcap rose 27.5% compared to 22.6% for the small-cap Russell 2000 Index, 10.3% for the large-cap Russell 1000 Index, and 2.0% for the mega-cap Russell Top 50 Index.
For the 1-year period ended 6/30/26, the Russell Microcap Index advanced 58.5%, the Russell 2000 Index rose 40.8%, the Russell 1000 Index gained 22.0%, and the Russell Top 50 was up 16.3%.
From the market low on 4/8/25 through 8/14/26, the Russell Microcap increased 109.0%, the Russell 2000 rose 77.2%, the Russell 1000 gained 58.6%, and the Russell Top 50 was up 54.0%.
What’s Driving Micro-Cap Performance?
Much of the attention that small- and micro-cap stocks have been getting over the last several months has been tied to the increasingly important roles that many smaller companies have been playing in the AI infrastructure buildout, which covers everything from semiconductors (and related components and services), data center construction, and enhanced power needs.
It’s no surprise, then, that in the first half of this year, Information Technology led all sectors within the Russell Microcap Index, powered by robust performance from the semiconductors & semiconductor equipment industry, which was up 183.2% and contributed more than 400 basis points to the index’s year-to-date return.
However, biotechnology, banks, and software were also strong performers. All told, 10 of the index’s 11 sectors contributed to year-to-date results, with health care, industrials, financials and energy (which has admittedly been volatile due to the war with Iran) also contributing meaningfully. Utilities was the only detractor, and its losses were marginal.
From the April 2025 low through the end of June 2026, all 11 sectors were in the black. Somewhat surprisingly, health care was the biggest contributor, followed by information technology, financials, and industrials. Within health care biotech was especially strong thanks both to robust performance—a gain of 228.3%—and its relatively large weight within the index of just under 14%. Similarly, banks were a standout due to a 58.6% return and the industry’s 15.6% weighting in the micro-cap index. In both industries, gains were spread across several companies.
Within Information technology, software made the biggest positive impact (even as many software companies have struggled with the idea that AI will render them obsolete), followed by meaningful contributions from semiconductors & semiconductor equipment, electronic equipment instruments & components and communications equipment.
Plenty of Micro-Cap Opportunities Remain
Yet even in the context of recent market leadership and widespread positive performance, we are still finding attractive buying opportunities in nearly every corner of the micro-cap universe—which brings us to the two other reasons underlining our long-term confidence.
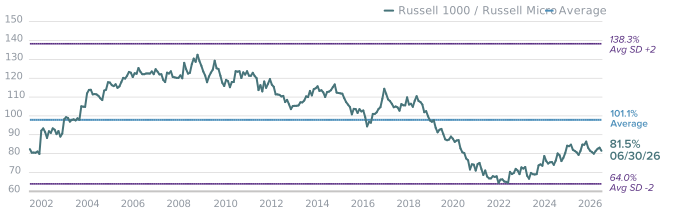
The first centers on relative valuations. Based on our preferred index valuation metric, enterprise value over earnings before interest & taxes or EV/EBIT, micro-caps as a group remain close to a 25-year low versus large-cap stocks at the end of June.
Relative Valuations for Micro-Caps vs. Large-Caps Remain Below Their Long-Term Average Over the Last 25 Years
Russell Microcap vs. Russell 1000 Median LTM EV/EBIT (ex. Negative EBIT Companies), 6/30/01-6/30/26
Source: FactSet.
The third element is earnings—which, as we often say, are what drives long-term performance for equities. Earnings fundamentals continue to improve for many small- and micro-cap companies. To be sure, consensus estimates are pointing to faster earnings growth ahead (as has been the case for the last several months). ). Yet even as earnings for micro-cap companies have been robust so far in 2026, the price-to-earnings (P/E) (excluding companies with negative earnings) and price-to-book (P/B) ratios for the Russell Microcap remained quite reasonable at the end of June, coming in at 16.6x and 2.2x, respectively. In both cases, they were also much lower than the same metrics in the Russell 1000 Index: the large-cap index’s P/E ratio (excluding companies with negative earnings) was 25.8x at then end of June, and the P/B was 5.3x.
Small-Cap’s Estimated Earnings Growth Is Expected to Remain Higher Than Large-Cap’s in 2026 and 2027
One-Year EPS Growth
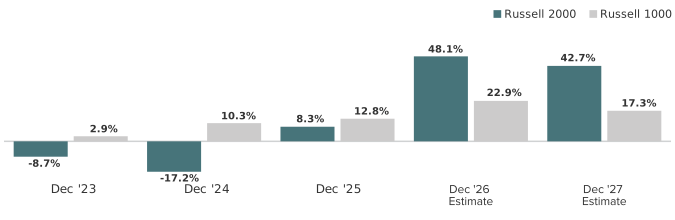
Source: FactSet. Earnings per share (EPS) is calculated as a company’s profit divided by the outstanding shares of its common stock. The EPS Growth Estimates are the pre-calculated mean two-year EPS growth rate estimates by brokerage analysts. Estimates are the average of those provided by analysts working for brokerage firms who provide research coverage on each individual security as reported by FactSet. All non-equity securities, investment companies, and companies without brokerage analyst coverage are excluded. Past performance is no guarantee of future results.
Based on this data, as well as the fundamental and operational strengths we see in many companies, the small- and micro-cap leadership cycles looks like it’s just getting started.
Index Definitions
Indexes are unmanaged and one cannot directly invest in them. They do not include fees, expenses or sales charges. Past performance is not an indicator of future results.
The Russell 1000 Index is an unmanaged, capitalization-weighted index of domestic large-cap stocks. It measures the performance of the 1,000 largest publicly traded US companies in the Russell 3000 Index.
The Russell 2000 Index is an index of domestic small-cap stocks that measures the performance of the 2,000 smallest publicly traded US companies in the Russell 3000 Index.
The Russell Microcap Index measures the performance of the microcap segment of the US equity market. Microcap stocks make up less than 3% of the US equity market (by market cap) and consist of the smallest 1,000 securities in the small-cap Russell 2000® Index, plus the next smallest eligible securities by market cap.
The Russell Top 50 Mega Cap Index measures the performance of the 50 largest companies in the US equity market, capturing dominant mega-cap corporations spanning key sectors like technology, consumer discretionary, and health care.
WHAT ARE THE RISKS?
All investments involve risks, including possible loss of principal. Past performance is no guarantee of future results. Please note that an investor cannot invest directly in an index. Unmanaged index returns do not reflect any fees, expenses or sales charges.
Active management does not ensure gains or protect against market declines.
Equity securities are subject to price fluctuation and possible loss of principal.
Commodities and currencies contain heightened risk that include market, political, regulatory, and natural conditions and may not be suitable for all investors.
Small- and mid-cap stocks involve greater risks and volatility than large-cap stocks.
US Treasuries are direct debt obligations issued and backed by the “full faith and credit” of the US government. The US government guarantees the principal and interest payments on US Treasuries when the securities are held to maturity. Unlike US Treasuries, debt securities issued by the federal agencies and instrumentalities and related investments may or may not be backed by the full faith and credit of the US government. Even when the US government guarantees principal and interest payments on securities, this guarantee does not apply to losses resulting from declines in the market value of these securities.
Any companies and/or case studies referenced herein are used solely for illustrative purposes; any investment may or may not be currently held by any portfolio advised by Franklin Templeton. The information provided is not a recommendation or individual investment advice for any particular security, strategy, or investment product and is not an indication of the trading intent of any Franklin Templeton managed portfolio. Past performance does not guarantee future results.
Any data and figures quoted in this article (unless stated) are sourced from FTSE Russell, FactSet, Bloomberg and Reuters.
Important data provider notices and terms available at www.franklintempletondatasources.com. All data is subject to change.
WF: 12153012